The unique visual approach to predictive modeling

The Viscovery® software suite provides data scientists as well as business users a versatile and powerful set of tools. Analytical work is supported with workflows that allow for easy and efficient creation of predictive models.

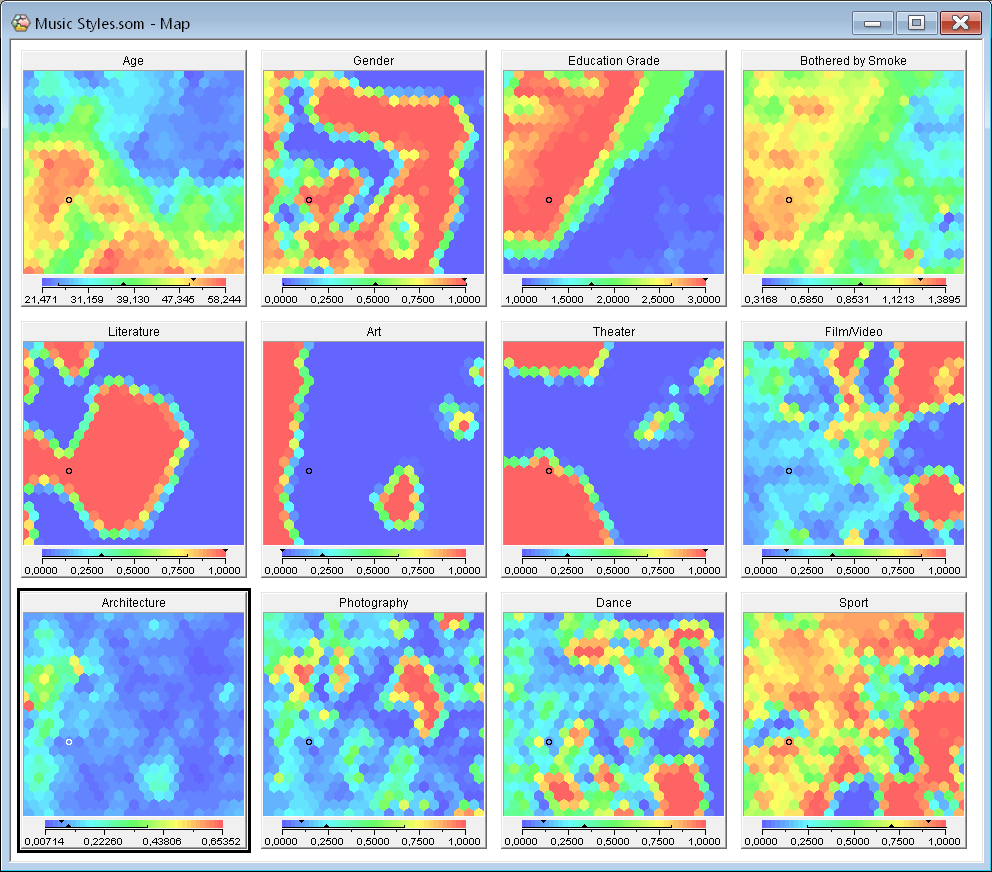
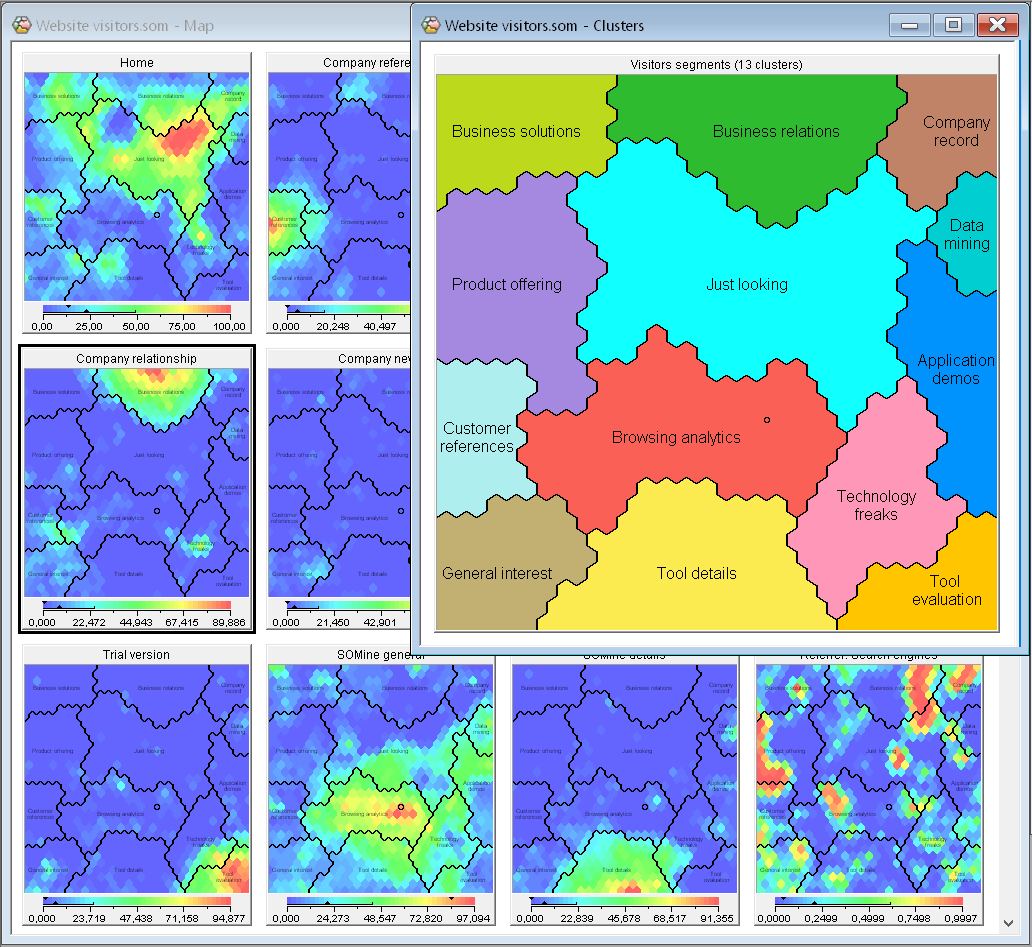
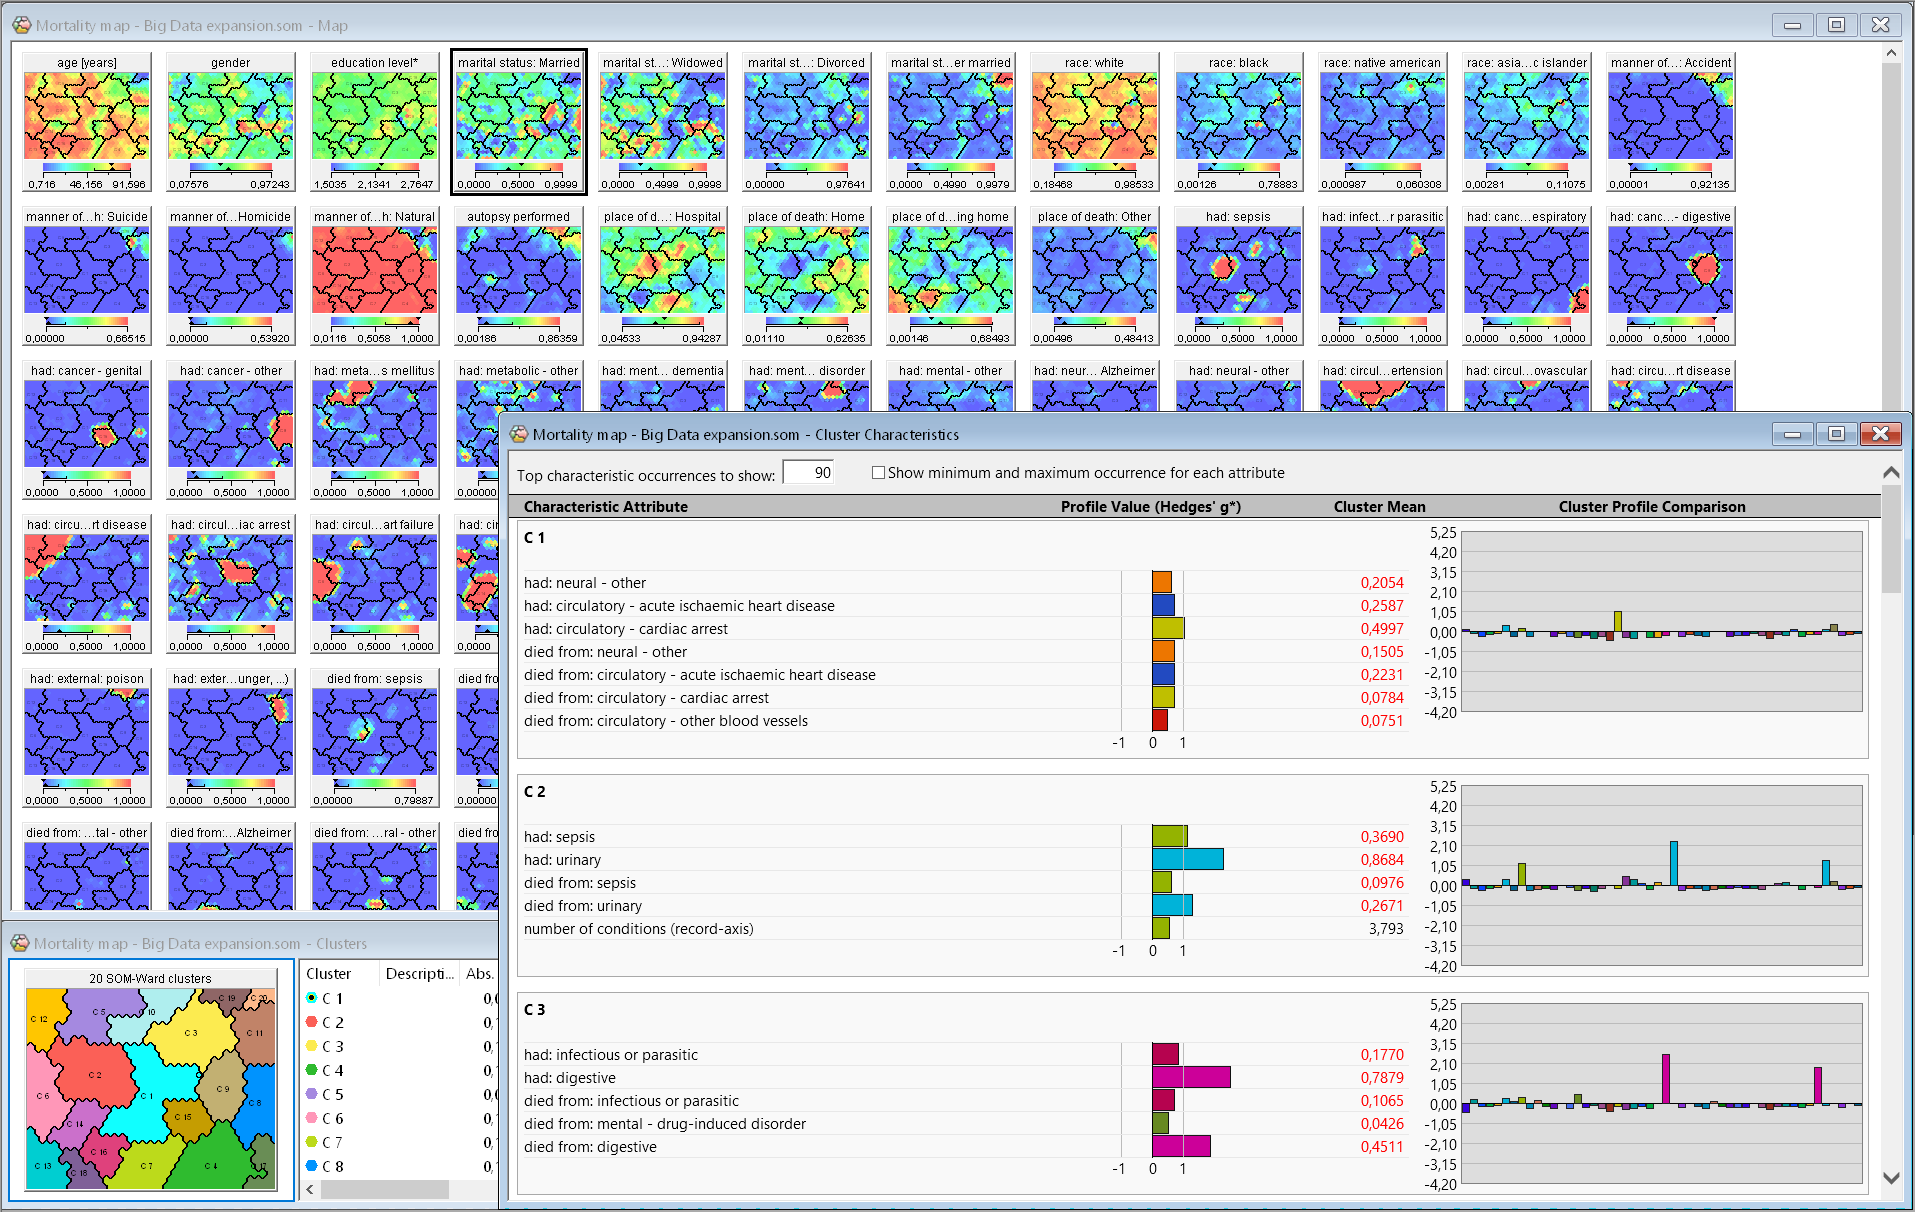
Using the combined power of self-organizing maps and multivariate statistics, Viscovery technology reduces complexity and lets clients visually comprehend the essence of their data. Viscovery models enable visual exploration of clusters and dependences and ultimately enrich business processes with quick, data-driven decisions that provide competitive advantage.

Viscovery AI Alliance

Viscovery AI Alliance is a consortium of the companies Viscovery Software GmbH, STAT-UP Statistical Consulting & Data Science, MergeFlow AG and microstep AG. Our team has extensive and long-standing expertise in the fields of AI, Data Science, Statistics, and IT, which is proven by numerous reference projects. Viscovery AI Alliance can provide resources and expertise to implement extensive data science projects in various domains. Our machine learning analyses and methods are mentioned in more than 500 publications and are used in many business domains worldwide.

Vicovery AI Alliance offers:

  • Consulting for data science projects.
  • AI-based decision support systems.
  • Software focused on self-organizing maps (SOM) with the following features, among others:
    • Excellent results even with a limited amount of data.
    • Fast analyses through "no code" approach.
Test your own music style

Test your own music style

Using responses to a questionnaire about social demographic variables and hobbies, including music preferences, a SOM was generated, which was used to display music interests over the generated clusters. Locate your own profile in the map!

Show demo
Snow crystal image classification

Snow crystal image classification

Using a historical archive of snow crystals micrographs, an ordered map of crystal types is created. Photographic elements are ordered based on intermediate image processing to determine similarity and can be accessed interactively by the user.

Show demo
Website visitors

Website visitors

Using click data recorded for website visitors, cluster analysis is performed and user profiles are created for real-time classification of the current visitor based on click behavior.

Show demo
Big Data visualisation

Big Data visualisation

Using a dataset of 22.5 million death records from the United States, we show how Big Data can be quickly visualized and analyzed with Viscovery SOMine.

Show demo
  • 0
  • 1
  • 2
  • 3

Proven technology from the leading vendor in self-organizing maps

  • Mature, reliable software, under continual development for more than 20 years
  • Workflow navigation through analytical projects
  • Self-explanatory user interface
  • Comprehensive data mining capabilities
  • Numerous customers worldwide, including consulting firms and universities

Discover our products

Viscovery® SOMine® is a workflow-oriented software suite based on self-organizing maps (SOM) and multivariate statistics for explorative data mining and predictive modeling.

The system excels in intuitive user-guidance, mature implementation and a consistent focus on applications. Benefit from the unmatched compactness and elegance of Viscovery’s visual data representation.


Visual Explorer

F R E E

Viscovery SOMine

Download

Basic module 

Selection of commercial Viscovery customers

Selection of scientific Viscovery customers

Erstebank“By the unique visualization the user obtains an excellent overview on the characteristics and distributions of, and interdependencies in the data. This is most helpful in explorative data analysis.”
derStandard“User behavior analysis implemented by Viscovery allowed us to significantly increase our advertising revenues.”
Internet User Behavior Modeling
Donauland“The visual exposition in Viscovery gives a spatial structure to the variables that closely matches human imagination. This simplifies the presentation of new models and the explanation of complicated dependencies considerably. The software supports the treatment of the data so cleverly that one can immediately concentrate on the contents and dependencies.”
Generali“... long-term visions, visualization options, and results which one also understands as non-statistician. Important contributions to the success of our analytics projects - provided by Viscovery”.
Cross-selling
Obi“Viscovery helped us to get fast an even clearer picture of our customers. The analyses in Viscovery made it possible to employ our advertising material even more efficiently.”
Advertisement Optimization
One“Viscovery's concept of data visualization has opened the door for a detailed customer inspection. It is now possible to receive information on a mere button press that enables us to approach our customers according to their needs. This is particularly crucial in the highly competitive mobile telecommunication market.”
Swisscom“The unique data visualization, the user-friendliness, and the outstanding presentation capabilities of the software play a decisive role in our analysis process.”
Ytong“YTONG was able to gain valuable insights with Viscovery and to adjust miscalculated parameters which frequently caused faulty production.”
Manufacturing